-
-
-
-
-
-
-
-
-
-
-
-
-
-
-
Transport
Community Outcome: Otago has an integrated transport system that contributes to the accessibility and connectivity of our community, reduces congestion and supports community wellbeing aspirations.
Relevance
Monitoring patronage is an important way to assess how well Otago’s transport system supports accessibility and connectivity. By tracking patronage trends over time, ORC can assess whether the transport system is meeting its intended purpose and identify where improvements or service adjustments may be needed.
Current situation
Summary
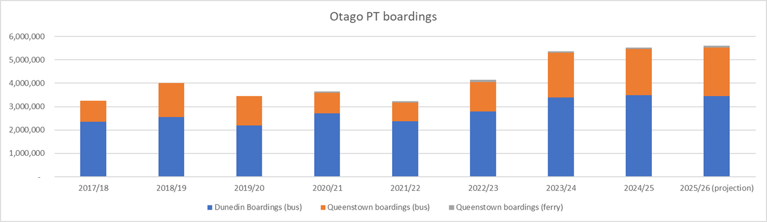
Public transport usage in Otago is increasing.
Supporting information
Boardings on the region’s buses and the Queenstown ferry have risen sharply since service reliability was restored following post-Covid driver shortages.
Patronage is now 37% above pre-Covid levels in Dunedin and 34% above pre-Covid levels in Queenstown.
How is it measured
Public transport patronage is measured by the number of boardings, based on ticketing data. Data is collected continuously and reported annually.
Relevance
Affordability of bus fares is a key factor in ensuring that Otago’s transport system is accessible and inclusive for all members of the community. When fares are affordable, more people—particularly those on lower incomes, students, and seniors—can use public transport, ensuring that cost is not a barrier to participation.
Current situation
Summary
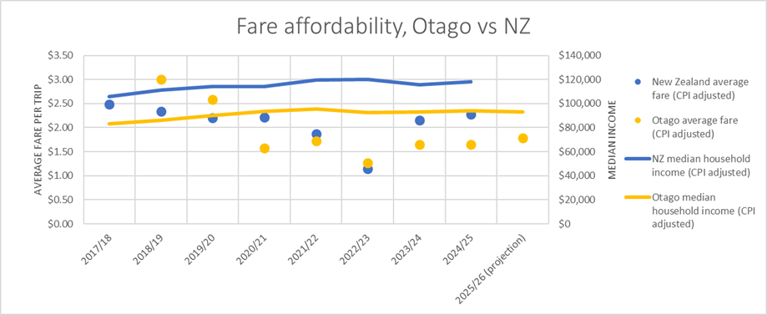
Prior to 2023/24, bus fares in Otago appeared to be less affordable than the New Zealand average. Over the past two years, affordability in Otago has been more comparable with the rest of the country.
Supporting information
The average fare in Otago has been lower than the New Zealand average since 2020/21, except for the 2022/23 year.
Since 2020/21, changes in average bus fares in Otago have broadly followed changes in Otago median household income. However, a change in base fares in September 2025 has increased average fares relative to median household income.
The referenced graph includes both bus and ferry fares. Nationally, fares were significantly lower in 2022/23 due to central government funding that enabled half-price fares.
How is it measured
Affordability is measured by comparing the average fare per trip against median household income.
Relevance
Monitoring the use of the Total Mobility service is an important way to assess how well Otago’s transport system supports accessibility and inclusion. The service enables people with disabilities or long-term impairments to travel independently and reliably, supporting full participation in community life.
Measuring usage helps the council understand whether transport options are meeting the needs of all residents, particularly those who face barriers to using standard public transport.
However, patronage data alone does not fully indicate accessibility. For example, if some users who could use accessible bus services are instead reliant on Total Mobility, this may signal barriers in the wider public transport network.
Understanding these patterns helps ensure that people with the greatest mobility needs can access transport when required, while also guiding improvements to accessibility across the entire network.
Current situation
Summary
The number of registered Total Mobility card holders has almost doubled over the past four years, and service coverage has expanded, indicating that the programme is supporting a growing number of users.
Supporting information
Patronage has increased significantly since April 2022, when the subsidy level rose from 50% to 75%.
| Measure | 2021/22 | 2022/23 | 2023/24 | 2024/25 |
|---|---|---|---|---|
| Registered card holders | 3,743 | 4,383 | 5,545 | 6,642 |
| Number of trips | 89,705 | 109,360 | 123,826 | 142,312 |
| Number of hoist trips | 11,818 | 15,795 | 18,696 | 22,015 |
| Wheelchair-accessible vehicles | Data not available | Data not available | 24 | 29 |
Service coverage expanded over the reporting period to include Dunedin, Queenstown, Wānaka, Oamaru, and Balclutha. Services also commenced in Alexandra during the current 2025/26 reporting period.
Customer satisfaction levels remain high.
How is it measured
Total Mobility service use is measured using patronage and registration data in areas where the service operates. Data is collected continuously and reported annually.
Relevance
Carbon dioxide (CO2) and nitrogen dioxide (NO2) emissions contribute to urban air pollution. By transitioning to a low-emission public transport fleet, ORC can support improved human health outcomes, encourage the uptake of cleaner technologies, and help reduce regional greenhouse gas emissions.
When people choose to travel by bus instead of by car, air quality improves and greenhouse gas emissions are reduced by taking more vehicles off the road. This also helps lower household fuel costs and strengthens economic resilience by reducing reliance on volatile petrol prices.
Current situation
Summary
CO2 and NO2 emissions from the public transport fleet are decreasing.
Supporting information
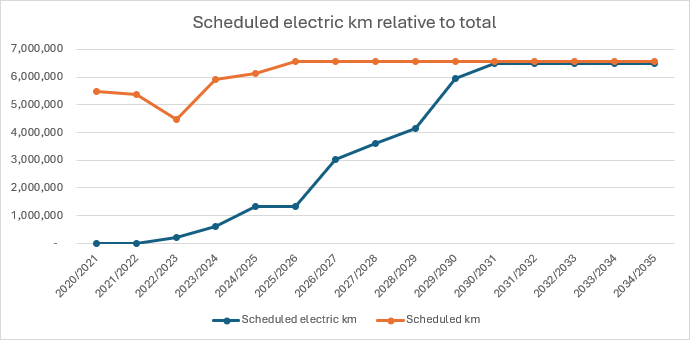
The proportion of kilometres scheduled to be driven by electric buses in Otago is increasing each year. As a result, the number of kilometres driven by diesel buses is decreasing.
From as early as the 2029/30 financial year, when new Queenstown bus contracts come into force, it is possible that diesel buses will be fully replaced by electric buses, resulting in no emissions from diesel buses in that fleet.
How is it measured
Progress is measured by reporting the number of kilometres scheduled to be driven by electric buses each year.